
Transforming Financial Data Analysis with Python and Advanced Data Visualization
Client
Challenge
We developed a custom software solution using Python and advanced data visualization tools to address these challenges
Python Integration
Built a robust backend using Python to automate data collection, cleaning, and processing. Used libraries like Pandas and NumPy for efficient data manipulation.
Custom Reporting
Designed client-specific reports with visually appealing charts, graphs, and heatmaps. Enabled automated report generation and delivery via email.
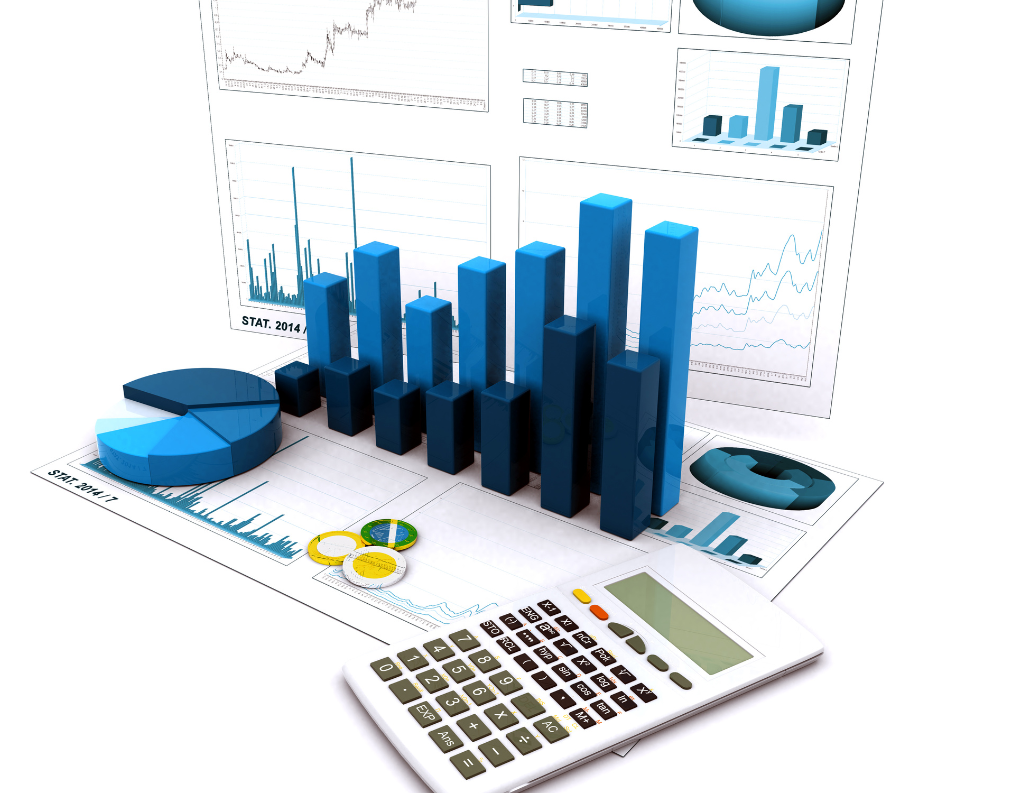
Data Visualization
Integrated Matplotlib and Plotly to create interactive and dynamic visualizations. Developed dashboards using Dash (a Python framework) for real-time data exploration.
Scalable Architecture
Deployed the solution on a cloud platform for scalability and accessibility. Ensured seamless integration with the client’s existing systems.
Result
Mr. A. Pal Pandial
General Manager, Finolen FinanceThe solution developed by TensorLearners has completely transformed how we analyze and present financial data. The Python-based system is not only powerful but also incredibly user-friendly. Our clients love the new reports, and our team can now focus on strategic insights instead of manual data crunching.